

What the DXY tells you that EUR/USD doesn't
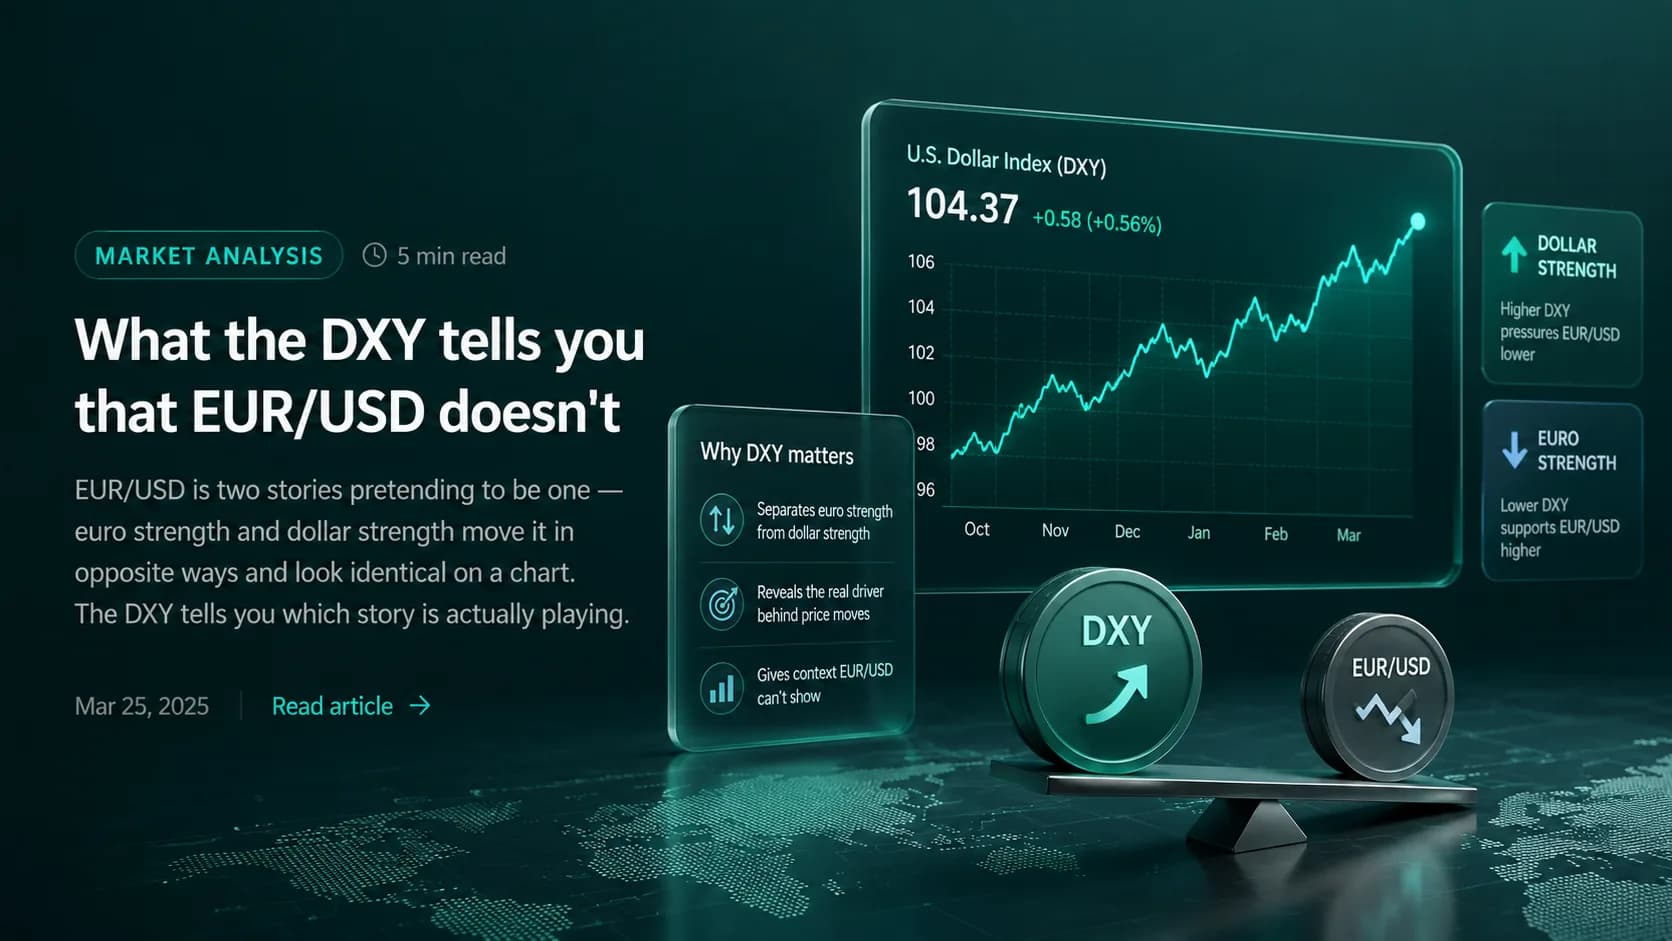
EUR/USD is two stories pretending to be one — euro strength and dollar strength move it in opposite ways and look identical on a chart. The DXY tells you which story is actually playing.
EUR/USD up 100 pips. Easy interpretation — euro got stronger. Wrong. EUR/USD up 100 pips means EUR/USD got bigger; the move could come from the EUR side, the USD side or both. The dollar index — DXY — is the cleaner read on USD direction because it averages USD against six majors. When DXY is down and EUR/USD is up, the move is dollar weakness. When DXY is flat and EUR/USD is up, the move is euro strength.
Why this matters
You're not trading EUR/USD because of the chart shape; you're trading it because of a thesis. "Fed cuts faster than ECB" is a dollar-weakness thesis — your EUR/USD long should track DXY downward moves. If DXY isn't moving and EUR/USD is, your thesis is wrong even if the trade is profitable. Profitable wrong trades become unprofitable trades the next day.
The two-chart workflow
Open EUR/USD and DXY side by side. Mark the same price action on both. If they're mirror images (up on one, down on the other), the dollar is driving — your USD-based thesis applies. If EUR/USD is moving and DXY is flat, the euro is driving — go look at Bund yields, ECB minutes, and Eurozone CPI for the real story.
Most retail traders never open the second chart. The dollar half of every FX trade stays invisible until they get blindsided by an FOMC reaction that doesn't match their expectations.


